Author: Linda Harnisch
For a long time, the standard marketing dashboard was the operational centerpiece for app marketers. That is, a relatively straightforward collection of APIs feeding real-time spend, installs, and CPIs into a clean grid. The objective was visibility. We wrote about this topic back in 2020 and provided a simple Cheat Sheet for organizing your channels and visualizing key metrics.
What matters now in 2026 is not how polished your charts look but the structural integrity and the data logic happening beneath the surface. Senior growth leads have moved beyond the days when basic data visualization was their biggest headache. Today, they are navigating an ecosystem defined by extreme fragmentation. With the full maturation of Google’s Privacy Sandbox and the continuous evolution of Apple’s ad attribution kit, the infrastructure behind the dashboard has become significantly more critical than the graphs themselves.
This shift forces teams to entirely rethink how their backend architecture handles attribution data as the ecosystem moves away from traditional tracking methods and fully embraces privacy-preserving APIs. To understand the data logic required to bridge this gap, the following explainer video breaks down how modern conversion signals are aggregated and processed before they ever hit your screen:
Why 2026 demands a strategic shift in measurement
We often see dashboard discussions focus on chart layouts, KPI selection, and visual presentation. While these elements matter they rarely determine whether marketing teams make better decisions. While clean presentation remains important for internal alignment, the real strategic challenge lies in attribution logic and data unification.
We believe the industry spends too much time chasing a single source of truth. In reality, different measurement systems answer different questions. The goal is not to force every number to match but to understand why they differ and what decision should be made based on those differences. We are no longer just measuring clicks but reconciling deterministic data with heavily modeled, probabilistic signals. From our perspective, if your dashboard does not account for the incrementality of your spend across fragmented channels, it isn’t fit to be a tool for strategic decision-making but merely a collection of vanity metrics that tell you very little about actual business growth.
Connecting the growth infrastructure
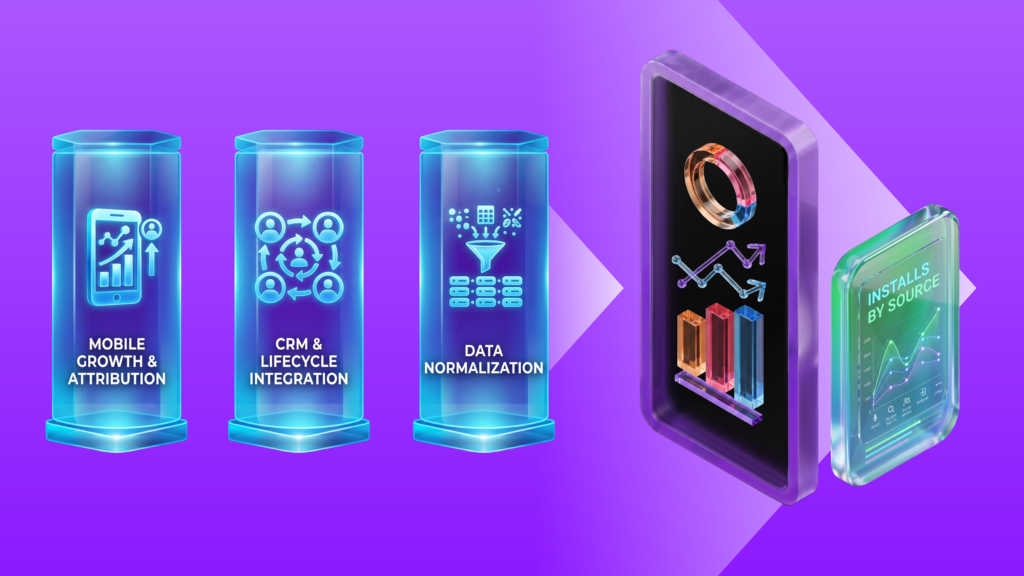
At Customlytics we view dashboarding as a fundamental component of your technical setup. To make marketing performance truly measurable, a dashboard must actively bridge several key areas.
Right now, privacy updates mean that Apple and Google give you data that is mostly grouped together, while your Mobile Measurement Partner (MMP) tries to give you real-time tracking. Your system needs to show these different data types side-by-side without overlapping. If it doesn’t, you will end up counting the same app install twice and wasting your budget on the wrong ad networks.
Good marketing shouldn’t stop the moment someone downloads your app. Your dashboard needs to connect what a user does inside the app directly back to the ad campaign that brought them there. This allows you to see the true long-term value of your users. When you link product data with marketing spend, you can easily spot which campaigns bring in active, paying users versus those that just bring in cheap, one-time downloads.
Ensuring that your BI/data warehouse is not just a passive storage unit but a processing engine that normalizes data across varying attribution windows and network APIs (= data normalization). Your central data hub shouldn’t just be a digital storage room where you dump raw files. It needs to actively clean up and align your numbers. Different networks and ad platforms use different time zones and tracking windows. If your backend system isn’t automatically fixing these mismatches before the numbers reach your screen, your dashboard will show conflicting data that makes it impossible to make quick decisions.
From simply reporting to steering (or, active navigation)
From our perspective, the most successful app teams have moved beyond reporting (What happened yesterday?) and towards steering (What should we do next?). We believe the era of dashboards as reporting tools is largely over. Their primary purpose should be to support decisions.
A useful dashboard should quickly reveal what is driving growth, whether performance is developing as expected, and where teams should focus their next optimization efforts. Too many dashboards try to show everything at once and end up creating information overload rather than clarity.
In our view, a dashboard should answer three questions:
- What is driving performance right now?
- Are we performing better or worse than expected?
- Where should we invest our attention, budget or resources next?
If a dashboard cannot help answer these questions, it risks becoming a reporting tool rather than a decision-making tool. To build a dashboard setup that actually facilitates scaling, we would advise marketers to focus on these three core success factors:
A unified attribution logic. That is, the technical capability to display side-by-side views of different attribution models (e.g., Last Click vs. Incrementality) without creating internal confusion. This requires the technical capability to ingest and display side-by-side views of different attribution models such as classic last click from your MMP alongside top-down incrementality modeling or MMM forecasts. Achieving this means building a common data schema that allows these varying models to coexist in the same visualization without creating internal confusion about which number is „correct.“ Instead of searching for a single source of truth, your dashboard becomes a tool for understanding the discrepancy between platform-reported value and actual business value, giving you a truer picture of your marketing efficiency
Semantic consistency ensuring that terms like organic or retention are defined identically across ASO, UA, and product teams. If everyone is measuring differently, the dashboard becomes useless. Without this alignment, your ASO team might report a lift in organic installs that the product team categorizes as internal cross-promotion, and your UA team might define a retained user at Day 7 while Product measures at Day 30. If every department is measuring their KPIs differently at the definition level, the dashboard becomes useless as a steering tool, leading to siloed reporting and conflicting growth strategies.
Predictive analytics incorporates a layer that forecasts end-of-month performance based on early-stage user journey signals rather than just looking at historical data. We expect forecasting capabilities to become a standard component of modern marketing infrastructure. Teams that only review historical performance will increasingly struggle to react quickly enough in a fragmented attribution environment. This forward-looking approach allows growth leads to make rapid, infrastructure-led decisions about budget allocation before precious spend is wasted on lagging cohorts.

Practical implications: What does this mean for your daily operations?
First, move away from the question „Which tool should we use?“ and towards „How is our data normalized?“. Whether you utilize one of the many solutions out there (Tableau, Looker etc.) or a custom-built internal solution, the technology is secondary to the underlying logic.
Second, actively bridge the gap between User Acquisition and CRM. If your UA dashboard fails to show the 30-day retention rate of the specific cohorts you are acquiring today, you are essentially flying blind. In 2026, the cost of acquisition is simply too high to ignore the long-term value of each user group.
To sum up, invest in the foundation! While unifying complex data requires a higher investment in infrastructure and data science, it unlocks a level of transparency that was previously out of reach. From our perspective, the ultimate competitive advantage belongs to the teams that can connect, normalize, and interpret fragmented signals to scale efficiently in the years ahead.
Helpful links: